Introduction
The following is a case study regarding a leading global market research company’s incentive reward program. They own and operate multiple research panels that deploy different incentives and delivery mechanisms to recruit, engage and retain panelists for research projects and programs. They actively engage millions of members with various client projects and programs. They have been a client of All Digital Rewards since 2012. All Digital Rewards approached the client to move off a pure cash-incentive-spend to a blended-reward-incentive mix of cash, prepaid debit cards, merchandise, and to apply advanced technologies to achieve a reduction in the overall program cash loyalty spend on incentives while at the same time improving customer experience, efficiencies in reward delivery, analytics and reporting. The client agreed to move one reward program to a blended reward mix.
All Digital Rewards recommended an incentive program change due to All Digital Rewards operating other loyalty programs for clients with a blended methodology and saving over of 18% or more on their cash incentive spend and felt that if this client applied the same methodologies to their other programs they would realize substantial savings.
A cash-based reward program is where the end-user, upon completing a qualifying market research activity (as in this case – could be other types of activities in other industries) is rewarded with a check, prepaid card, or PayPal in a cash denomination upon completing the desired behavior; whereas a blended-incentive reward program offers points or reward value to the end-user that they can spend towards a selection of incentive merchandise, digital rewards, and cash rewards (virtual visa, physical prepaid card, or check) as well.
The reason behind the rewarding of the end-user, in this study, is due to the market research company’s need to have proper mixes of demographics readily available to participate in questionnaires, surveys, or activities for the market research company’s clients. Some demographics are more difficult to engage than others, so a reward is necessary to not only attract those persons but also keep them engaged for future purchases.
Table of Contents:
– Situation
- Program 1 Rewards
- Program 2 Rewards
– Overall Challenge
– Solution
- Engagements Per User Compared
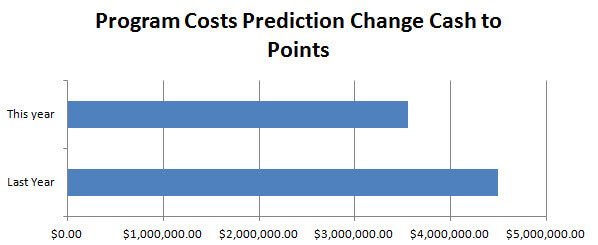
- Program Cost Prediction Change Cash to Points
– Conclusion
Situation
The Market Research client is spending large amounts of cash funds on loyalty reward projects and programs and is looking to cut their costs in order to be more efficient and competitive. In the grand scheme of things, the Client is running 2 different programs of which Program 1 is a points-based mixed product campaign and the other programs are cash-based reward programs. Program 2 is the largest of the cash-based programs and has the highest costs overall.
Program 2 is only offering prepaid plastic cards, prepaid virtual cards, and checks. All of which are cash-based. The end-users of this program are engaged at least once per month and sometimes as many as 5 times per month. Each time, the end-user is offered a sum of money to complete the task. Since each user is getting rewarded time and time again, the end-user is habitually choosing one of the 3 rewards and has generated a habit in how they handle those funds. It is unusual that these rewards are being used for anything other than for paying bills or other daily trivial purposes.
Program 1 Rewards
The cash reward is a simple link inclusive of a special code. This code triggers what the value of the rewards are, and offers a display of which rewards that are able to choose from. In this case, when the end-user clicks on the link, physical prepaid debit cards which take 4 to 5 weeks for delivery to the end-user; checks, which take 2 to 4 weeks to receive; and virtual prepaid debit cards, which are instantly delivered, but can only be used online or through a virtual wallet on smartphones or tablets.
Program 2 Rewards
Program 2 is offering points to their end-users for the completion of the same types of tasks. The end-user has access to cash-based rewards, just like Program 1, but also over 200,000 other products from movie tickets and dinner to clothing, electronics, and hunting gear. The incentives catalog is set up to drive the end-user to select popular lower cost items with high perceived value as well as promote games. This ensures the end-user is happy with their selections while driving the cost of the program lower than as with cash.
Program 2 also takes advantage of gamification where end-users burn off points for opportunities to win travel, sums of cash, or highly desired high-cost products like iPads, iPhones, or laptops and other tablets. The end-users are also offered the ability to play games. They can spend up to $3 in points for a few shots at a sweepstake where the cost to the company is very minimal, in this case, $0.54 per $3 spent using points.
In both programs, the end-user is pulled from the same demographic pool. The only true difference is the reward and how the reward is provided.
Overall Challenge
The overall challenge is to examine both scenarios and determine which scenario is going to present the best method to drive behavior, drive retention, and improve cost efficiencies.
First, we need to look at the cost of the products. Seeing as that cash is the most expensive product available, there is not much room to lower the cost of cash. Even if the cash were to have costs of face value, it is still the most expensive product. There is also the cost of inventory, distribution, and fulfillment that has to be taken into account. Plastic prepaid cards are expensive, checks cost admin time and effort, and virtual prepaid cards have less cost, but still have admin costs and inventory to manage. Regardless of those factors, looking at cash for the value presented is fundamental to this case study. Cash value and cost is the face value presented for this case study which is representative of a surface only costs analysis and is a good demonstrator for this case study. For example, a $10 reward has a cost of $10.
As for exposed driver type products in the incentive product offering, a margin has been built in to ensure a minimum margin of 5% after shipping. Other products are also provided that have a higher perceived value like movie tickets where the perceived value of 2 movie tickets might be $25, but the cost to the company might only be $18. This gives the product offering option a clear advantage when it comes to reviewing the cost structure.
Between the 2 programs, the number and value of rewards issued to the end-user are the same, however, the average cost of the rewards redeemed are dramatically different. This is due to redemption requiring the end-user to redeem the specific reward whereas the points program would allow the end-user to save up their points for a higher cost item. Knowing the number and values issued over the course of one year are the same, we noted that the average cost to the market research company for the points’ platform vs. the redemption was considerably different. Both programs issued $4.5M in rewards during this period. The redemption program had $4.49M redeemed with a total of 116681 redemptions and an average end-user spend of $38.55 per redemption. The points-based program redeemed $4.2M in points with a total of 65387 redemptions with an average end-user spend of $64.85.
Initially, this looks a little concerning, except for the fact that there are almost as much in volume for points being spent as there is for cash redemption. However, it was still slightly less. As we asked this question, the answer quickly became apparent that the end-users were actually saving their points earned to spend on higher desired items. This creates a liability that is addressed later.
Next, we can look at the ways the program distributes the rewards. In the case of the cash-based redemption program, there are specific events that ensure the cost of this program is higher than it should be. For example, when an end-user completes a task, they are rewarded $10.00 in cash. The end-user is going to utilize this cash every time. As is demonstrated in the graph above, there is no way for the end-user to burn this off and still be happy. There is also the fact that when it comes to cash, there is usually a cost to the company or the end-user for processing or making the transaction as mentioned earlier. So each reward is a transaction that is going to have a cost either to the end-user or the company; most always the company. The reward cannot be “banked” allowing the end-user to save up their rewards and cash in or transact one reward instead of 10 for the same end means. Even from a customer experience perspective, in the redemption process, if there are 10 rewards issued to a recipient, they will have to execute 10 actions to acquire their reward. Although not fully addressed in the cost discussion, the cost of producing 10 checks or 10 prepaid cards far exceeds the cost of producing one or five. Thus, having further affected the costs factors overall.
The next challenge was to continue to drop the cost by adding in top selections from Program 2 while not changing the process or taking away the cash options. In this, the only difference is that instead of the end-user having 3 options, they are offered 15 options. By the end of the first 3 months of having this option, it was noted that only 13% of the users had opted for another product outside of the cash options. In reviewing the costs factors, we found that the end-users were selecting items like movie tickets with a value of $25 to the end-user and a cost to the company of $18.00 or a 40% margin. Or the end-user would choose a cell phone recharger, with an 18% margin. Even though there are not a tremendous amount of end-users opting for the products that are not cash based, the margins of saving to the company are fairly significant. An increased saving of 6.7% average savings in cash cost reduction. During this time, the cost savings introduced solely by the introduction of these products was over $280,000 (this was initiated after the first 2 months in the year).
Gamification has had a large impact as well. There have been approximately 19% of the interactions for both cash based redemption and points based rewards. This is significant in and of itself. First, the primary action of adding products created a drop in costs. Gamification created a further drop where approximately 19% of the participants engaged in sweepstakes and instant win games. So much so that the cash-based redemption solution showed competitive cost savings between products and games of nearly 14% overall. During the short time of this review in the previous year, we had 24,537 game plays for a company savings of $60,156 for the 2-month period the games were in play. This would easily figure to a mid-six-figure cost savings over the course of a year with constant new games in play.
Solution
The ultimate solution is moving the end-user to the points program from the cash redemption program. So far, the cost savings have been fairly consistent with our expectations. There are higher expectations for new panelist since they would not have been indoctrinated into the program with a habit profile and expectation of cash as the sole reward. These users have a much smaller footprint in the selection of cash-based products increasing the overall cost savings. Since this is in the process of happening as of the writing of this case study, we have a simple compilation of what the program should look like in the coming year with the update in place.
There would be a small number of existing users that would drop off due to change on any level. However, we do note that redemption cashed based users had a lifecycle average of 7 interactions while the points-based program users averaged 18 interactions. This is significantly longer and reduces the amount of attrition by more than 60%. This makes the potential loss from the change minor in scope.

While keeping the cash-based products readily available, this should come across as an enhancement to the end-user rather than just a change.
Overall, the end-user will end up being able to “Bank” their points allowing them to set goals of effort to earn higher valued rewards that they can look at and want. This also lowers the costs due to product cost vs. cash costs. Further, gamification will be a commonplace tool to burn off unspent points as well as low-end point earners which keeps the end-user engaged as well as offs the books of liabilities. The points program also provides a broader range for how end-users can earn points. Rather than doing x, y, and z to earn a reward, they can earn points by completing x, y, and z., but get bonus points for completing them by W time frame. In the existing programs, there is an approximately 26% difference in cost between the cash-based program and points-based program. This has demonstrated itself several times across several clients in different situations. We will be watching this client’s move to a blended-reward program closely and will be able to follow up on it in the near future. This program is expected to have a savings of nearly 21% considering the mass of users have been indoctrinated in cash. Regardless, the savings expected, based on last year’s numbers should be between $825,000 and $850,000. This is not including transaction costs savings as well as extending retention and active engagements while lowering enrollment costs.
Conclusion
Between the two types of programs, it is significantly more cost effective to utilize points with an open series of incentives. When provided direction as to what incentives are presented to the end-user, those suggestions are highly utilized making points based programs much more efficient on costs savings in all areas; product costs, product transactions, gamification, and of course, management and required staffing to manage.
| Cash-Based Example | ||||||
| Product | Count | Value | Total Value | % Total | Client Costs | |
| Physical Card | 380 | $ 25.00 | $ 9,500.00 | 38% | $ 10,450.00 | |
| Virtual Card | 195 | $ 25.00 | $ 4,875.00 | 20% | $ 5,070.00 | |
| Checks | 325 | $ 25.00 | $ 8,125.00 | 33% | $ 8,563.75 | |
| Pay Pal | 100 | $ 25.00 | $ 2,500.00 | 10% | $ 2,550.00 | |
| Total | 1000 | $ 100.00 | $ 25,000.00 | 100% | $ 26,633.75 | |
| Mixed Product Example | ||||||
| Product | Count | Value | Total Value | % Total | Cost to You | |
| Cash Based | 600 | $ 25.00 | $ 15,000.00 | 60% | $ 16,005.00 | |
| Digital | 120 | $ 25.00 | $ 3,000.00 | 12% | $ 2,250.00 | |
| Physical | 90 | $ 25.00 | $ 2,250.00 | 9% | $ 1,575.00 | |
| Games | 190 | $ 4.20 | $ 798.00 | 19% | $ 112.10 | |
| Total | 1000 | $ 79.20 | $ 21,048.00 | 100% | $ 19,942.10 | |
| Based on real % use of product and costs between a Cash-Based Program and a Mixed Product Program | ||||||
In the case study, the first improvement was the addition of targeted products to be included as part of the selection, therefore, offering an alternative to cash which resulted in a 6.7% savings in costs. When gamification was added, an additional 14% in savings was introduced bringing the total savings to just over 20%. Gamification also has a large impact on the liability generated by having unspent pins or points in a program by providing added opportunities to burn off the points or PINs in such a way as to be a true value to the company and a lot of fun to the end-user.
All told, we see programs that begin with open selections and games that are easy to look at, access, and use show between 24% and 28% better cost outlay per person than cash-based reward programs. To learn more or have an open conversation about the numbers and costs associated, please feel free to contact Matt or one of the knowledgeable staff at All Digital Rewards.
About All Digital Rewards
All Digital Rewards is the leading customer engagement specialist that works directly with end-user, customer loyalty programs, and incentives. With customized web portals, businesses are finding it easier to establish a personal relationship with your customers and give the best customer experience possible. At All Digital Rewards, we are a technology company that provides programs for loyalty, recruitment, retention engagement and valuable analytics. We also provide a large selection of incentive programs such as cash-based, prepaid cards, check printing, digital rewards, reward cards, physical and experience-based rewards & fulfillment in both the US and internationally. All solutions are supported by an experienced support team which includes management and consulting. Request a demo today and let All Digital Rewards help you inspire loyalty!
Responsive, mobile, and promotion ready – All Digital Rewards.