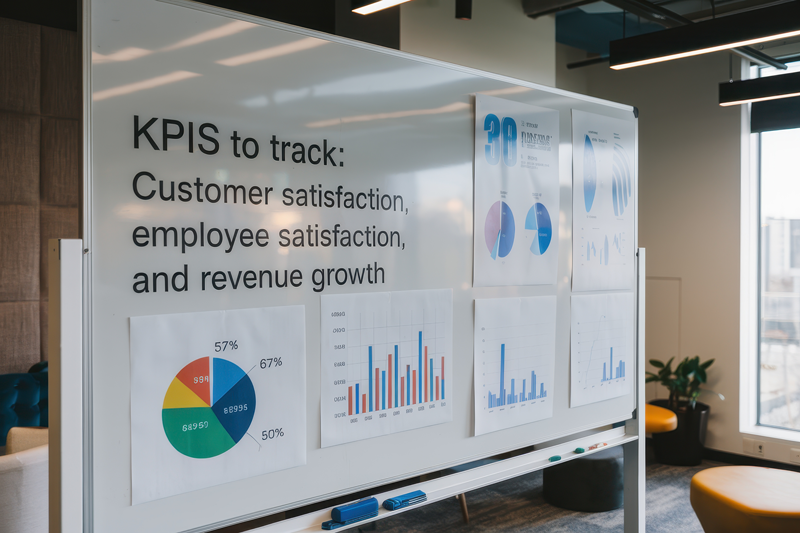
Sales Performance Incentive Funds (SPIFFs) can pack a powerful punch when it comes to boosting short-term sales. However, without a clear, data-driven strategy, your SPIFF might fizzle—offering limited long-term value or unclear ROI. Data and analytics bridge the gap between guesswork and fact-based decision-making. By systematically measuring key performance indicators (KPIs) and analyzing participant behavior, you can refine your SPIFF structures, rewards, and timing for maximum impact.
In this blog, we’ll explore proven methods for leveraging data and analytics to optimize every stage of your SPIFF program—from initial planning and tracking to post-campaign analysis. For a broader look at designing effective incentives, be sure to check our: “The Ultimate Guide to SPIFF Programs: Boosting Sales Performance”, or refer to “Top SPIFF Program Examples and How to Implement Them” for real-world inspiration.
Why Data Matters in SPIFFs
From Instinct to Insight
Traditionally, short-term incentives might rely on intuitive hunches—like pushing a slow-moving product or offering a quick bonus for an end-of-quarter sales bump. While instinct can spark a SPIFF idea, data helps you validate or refine that idea before you invest time and budget.
Transparent Feedback Loop
Data-driven SPIFF management provides immediate feedback to both sales reps and managers. By using real-time dashboards or leaderboards, participants can see exactly where they stand, while managers get a direct line of sight into overall performance, participation rates, and potential issues.
Measuring ROI
Without analytics, it’s hard to tell whether a SPIFF is truly successful—or simply adding overhead. Tracking incremental revenue, participant engagement, and cost-per-acquisition (CPA) ensures you know if the money spent on rewards is justified by the financial lift you’re seeing.
Setting the Stage with KPIs

Sales Metrics
- Incremental Revenue: Compare performance during the SPIFF period to a baseline period.
- Units Sold: Track product-specific or overall unit counts to see if your promotion is effectively pushing certain SKUs.
- Average Deal Size: In B2B contexts, see if bigger deals are closing under SPIFF conditions.
Participant Engagement
- Participation Rate: How many eligible reps actually engaged with the SPIFF?
- Completion Rate: Did participants meet or exceed the stated goals?
- Leaderboard Interactions: How frequently are reps checking standings? High engagement can signal a well-designed and motivating SPIFF.
Reward Costs & Profitability
- Budget vs. Actual: Compare your planned reward costs to what was ultimately paid out.
- ROI or Cost-Per-Acquisition (CPA): Evaluate the net revenue gain against total incentive spending.
Pro Tip: For guidance on managing budgets and tracking ROI, see “SPIFF Program Budgeting: How to Maximize ROI”.
Data Collection and Tools CRM Integration
One of the easiest ways to capture relevant data is by integrating your SPIFF with a CRM like Salesforce or HubSpot. Every deal closed, product sold, or new lead created can be automatically credited to the right rep—no manual intervention needed.
Incentive Management Platforms
Dedicated tools like All Digital Rewards (ADR) or other specialized platforms offer real-time analytics and automated reward fulfillment. Look for features like:
- Interactive Dashboards: Visualize top performers, participation rates, and overall revenue.
- Automated Payouts: Align reward distribution with pre-set conditions (e.g., upon deal closure).
- Custom Reports: Segment your data by region, product type, or time frame for deeper insights.
To learn more about selecting and implementing the right software, see “Best Software Solutions for Managing SPIFF Programs”.
Surveys & Feedback Loops
Quantitative data rarely tells the whole story. Combine analytics with qualitative feedback (e.g., short surveys or focus groups) to understand issues like:
- Reward Preferences
- SPIFF Duration Satisfaction
- Perceived Fairness
Analyzing Performance and Identifying Patterns
Segmentation
Break down data by product, region, or sales role:
- Product Segmentation: Did certain product lines spike more than others?
- Role Segmentation: Did inside sales benefit more than field sales?
This approach reveals if the SPIFF was uniformly successful or if some segments underperformed.
Correlational Insights
If your SPIFF used gamification, compare whether those who accessed leaderboards daily sold more than those who didn’t. If so, consider ramping up competition elements or investing more in user-friendly dashboards.
For more gamification tips, read “The Role of Gamification in Modern SPIFF Programs”.
Timely Adjustments
Real-time analytics let you tweak rewards, extend deadlines, or clarify rules mid-campaign:
- Low Engagement? Send reminders or add mini-challenges.
- Budget Surplus? Introduce an extra reward tier if participation is skyrocketing.
- Confusion Over Rules? Issue clarifications or host a brief Q&A.
A/B Testing for Continuous Improvement

Why A/B Testing Works
A/B testing involves running two variations of a SPIFF plan (or a single component of it) to see which one delivers better results. For instance, you might compare:
- Cash vs. Gift Card Rewards
- Tiered Bonuses vs. Lump-Sum Payouts
- Short 2-Week SPIFF vs. 4-Week SPIFF
Practical Steps
- Define Hypothesis: E.g., “Offering experiences (like travel vouchers) will yield higher engagement than simple cash payouts.”
- Split Your Group: Randomly divide participants or product lines into two cohorts.
Measure & Compare: Track metrics—revenue, engagement, ROI—to see which version outperforms.
Using Insights to Shape Future SPIFFs

Revisit Budget and Rewards
If your last SPIFF gave you a 3:1 ROI, can you scale the budget slightly for an even bigger return? Or was the cost structure too high, cutting into net profits?
Fine-Tune Timing
Review analytics to find ideal launch windows—peak times might be quarterly ends, holiday seasons, or new product rollouts.
Share Results & Celebrate
Don’t let your analytics remain buried in spreadsheets. Present concise reports to stakeholders—executives, sales managers, and reps—highlighting wins and areas for refinement. Recognize top performers and incorporate feedback to make your next SPIFF even better.
Common Pitfalls & How to Avoid Them
- Data Overload: Tracking too many metrics can lead to confusion. Focus on 2–3 core KPIs.
- Delayed Updates: If reps can’t see real-time or near-real-time standings, motivation wanes.
- Ignoring Qualitative Feedback: Numbers alone won’t explain why certain reps opted out or found the incentive unappealing.
Putting It All Together
By leveraging data and analytics, your SPIFF program moves from a simple guess-and-check approach to a precise, iterative strategy. Start by defining clear KPIs, integrate your incentive platform with robust CRM data, and regularly review performance dashboards. Combine quantitative insights with rep feedback for the full picture, and don’t hesitate to run A/B tests for continual improvement.
Conclusion
Optimizing your SPIFF program through data and analytics doesn’t just boost short-term sales—it establishes a culture of continuous learning and improvement. Each campaign becomes a treasure trove of insights about your reps, products, and market dynamics. By applying these learnings over time, you’ll sharpen your competitive edge, improve ROI, and keep sales teams engaged and eager for what’s next.
Ready to elevate your program further? Unlock the Full Potential of Your SPIFF Program— Contact All Digital Rewards and Talk to Our Incentive Experts Today!
